Monocle Dashboard
The Monocle Dashboard provides a real-time view of how traffic is interacting with your application, with a focus on identifying anonymised and potentially risky connections.
It allows you to monitor traffic quality, detect unusual patterns, and understand how users are connecting to your application.
What the Dashboard Shows
Monocle surfaces key metrics and insights to help you quickly assess traffic behaviour, including:
- Total traffic volume and session activity
- Anonymous traffic, including VPNs, proxies, and other anonymised connections
- Geographic distribution of traffic
- Behavioural patterns and anomalies
- Service and infrastructure sources
Assessment Overview
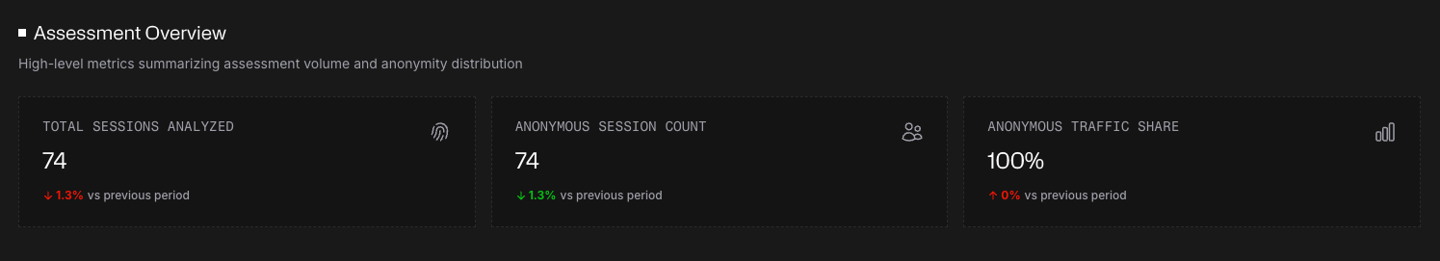
The Assessment Overview provides a high-level summary of traffic.
- Total Sessions Analyzed – The total number of sessions assessed by Monocle
- Anonymous Session Count – The number of sessions using anonymised connections
- Anonymous Traffic Share – The percentage of traffic identified as anonymised
These metrics give a quick indication of overall traffic quality. A high percentage of anonymised traffic may indicate bot activity, scraping, or abuse.
Traffic Overview
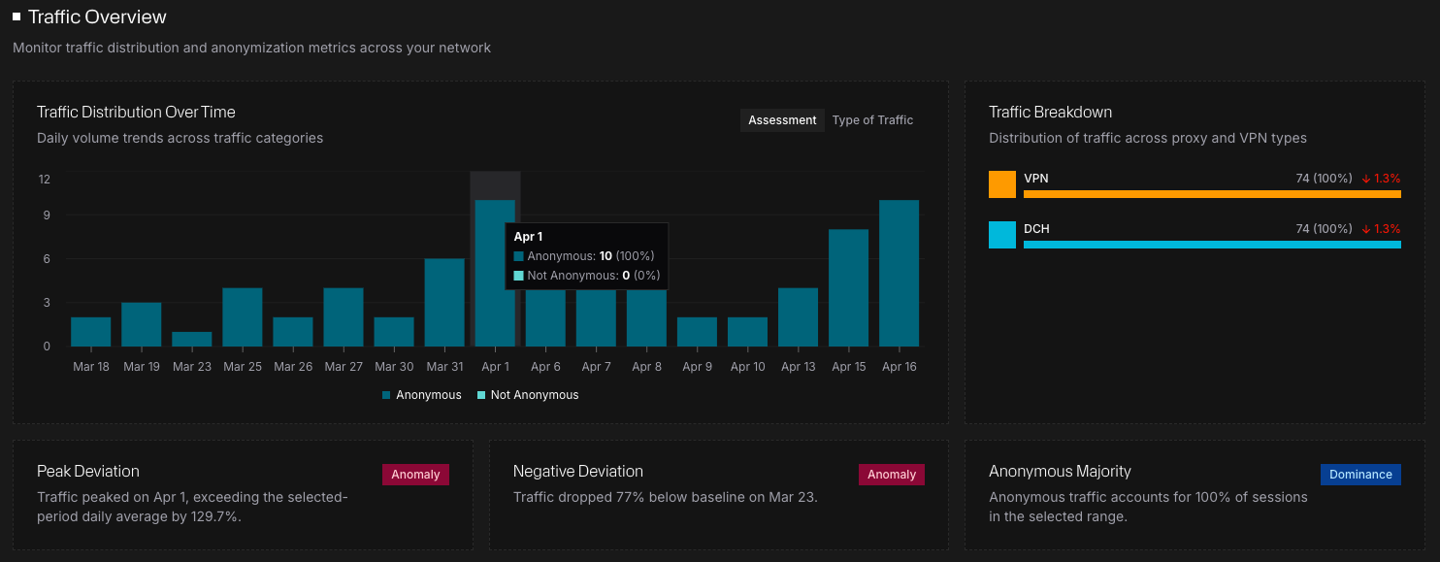
Traffic Overview shows how traffic changes over time.
- Daily traffic volume trends
- Breakdown of anonymous vs non-anonymous traffic
This helps identify spikes, drops, or unusual behaviour that may indicate abnormal or automated activity.
Traffic Breakdown
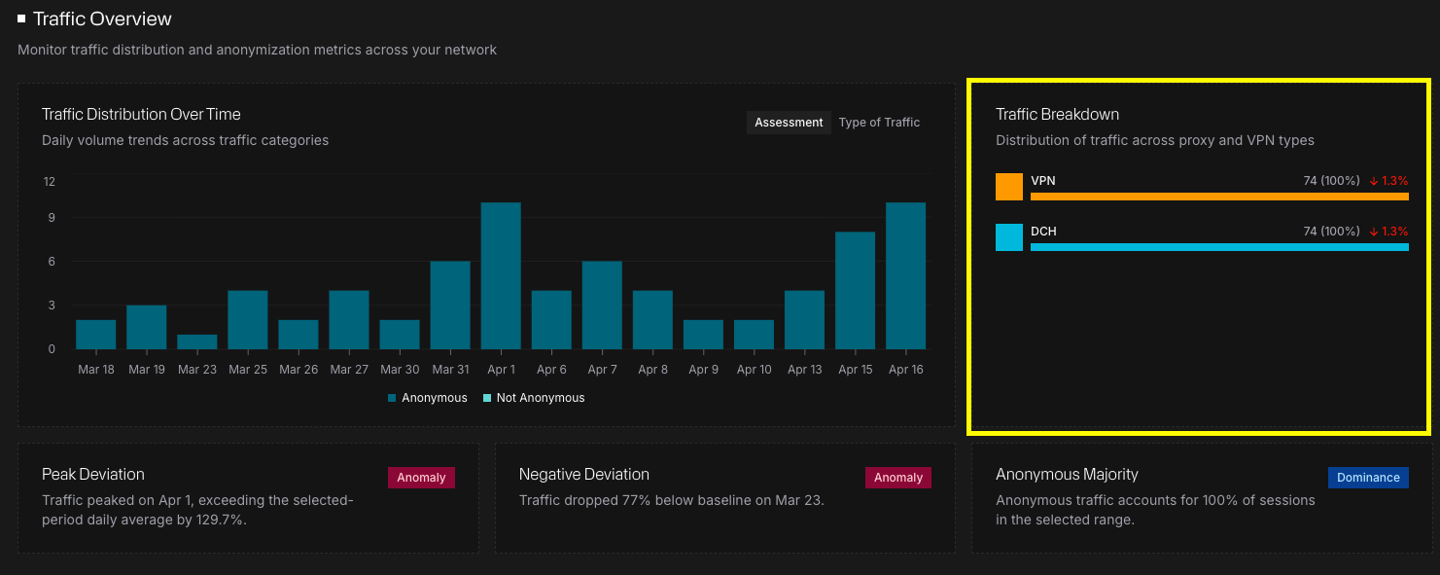
Traffic Breakdown shows the composition of anonymised traffic.
- VPN traffic
- Datacenter (DCH) traffic
Different traffic types can indicate different levels of risk. A high proportion of VPN or datacenter traffic may suggest non-genuine users.
Anomalies & Insights
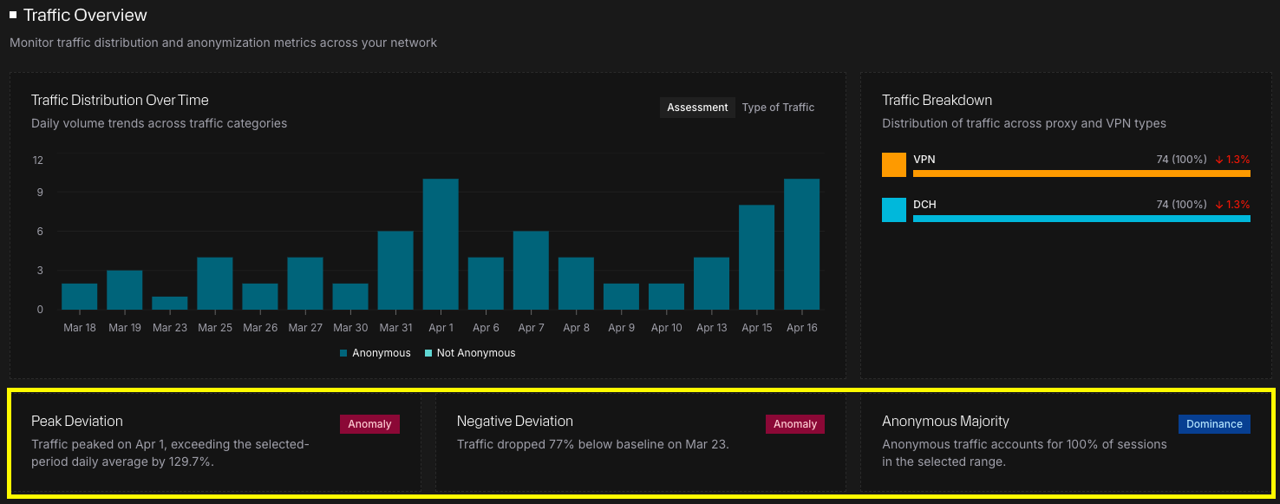
Monocle automatically highlights unusual patterns in traffic.
Examples include:
- Sudden increases or decreases in traffic
- Dominance of anonymised traffic
- Significant deviations from baseline behaviour
These insights help identify potential issues without manually analysing raw data.
Geo Intelligence
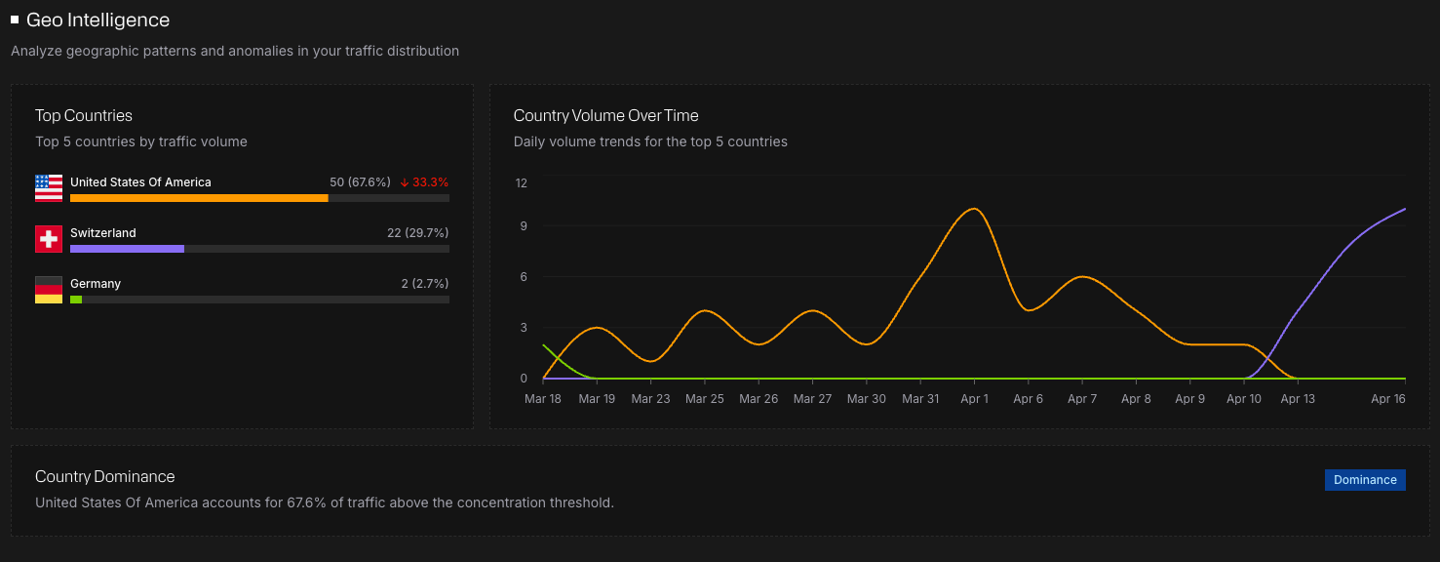
Geo Intelligence shows where traffic is originating.
- Top countries by traffic volume
- Changes in geographic distribution over time
Unexpected locations or sudden shifts in geography can indicate suspicious activity or new traffic sources.
Time of Day Behaviour
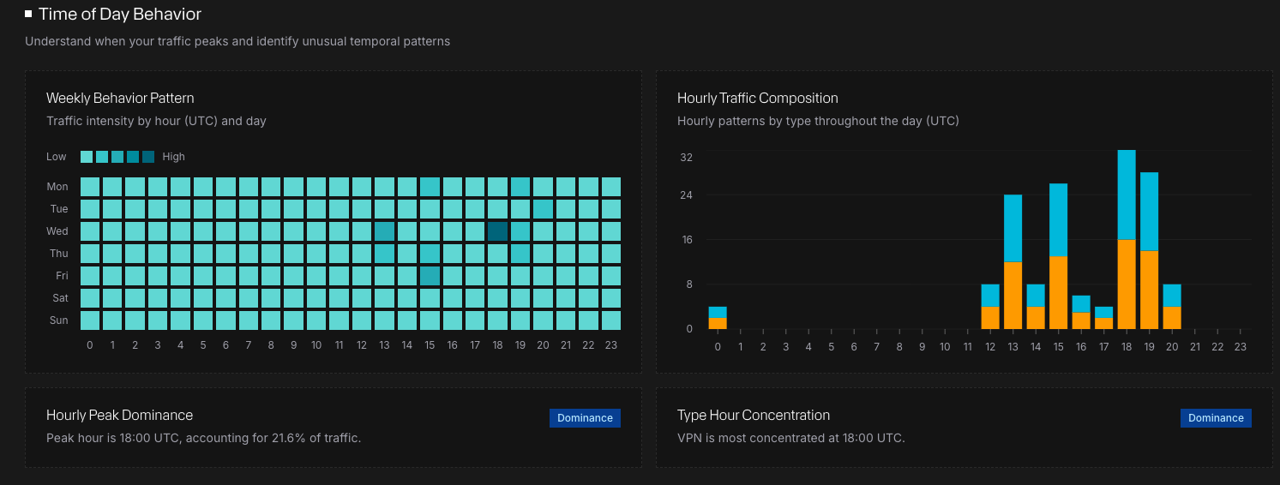
Time-based insights show when traffic occurs.
- Hourly traffic patterns
- Peak usage times
Unusual timing patterns may indicate automated or bot-driven traffic.
Service & Infrastructure Intelligence
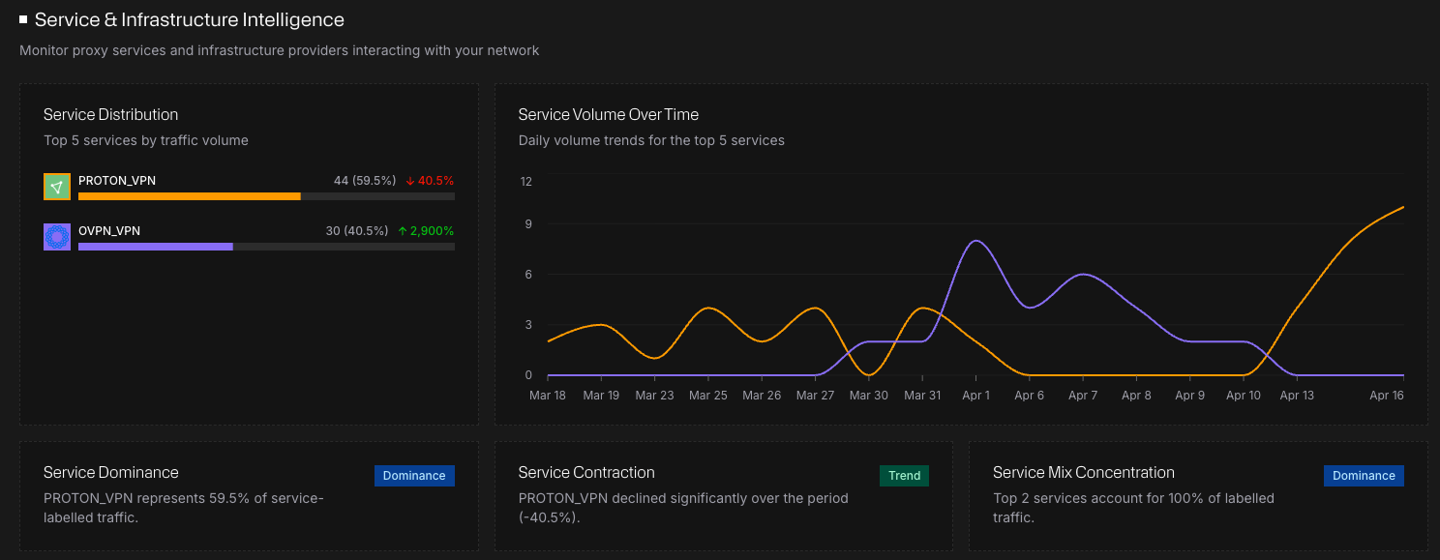
This section identifies the services and infrastructure generating traffic.
- VPN providers
- Proxy and infrastructure sources
Understanding which services are being used can help identify high-risk traffic and inform enforcement decisions.
Using Dashboard Insights
The Monocle Dashboard is designed to help you:
- Monitor traffic quality across your application
- Identify unusual patterns or anomalies
- Understand where traffic is coming from
- Decide whether to apply enforcement or blocking policies