
Changelog · — Monocle Assess & Enforce, policy decision logging, health alerts, and Install with AI.
Explorer
Explorer is Monocle's multi-dimensional traffic investigation view. Use it to break your traffic down by dimension (country, service, traffic type, IP and more), narrow it to the slice you care about, and see which sessions your policy allowed or blocked.
Open Explorer from your application in the Monocle dashboard, or select Explore on the Policy page to open its Policy tab.
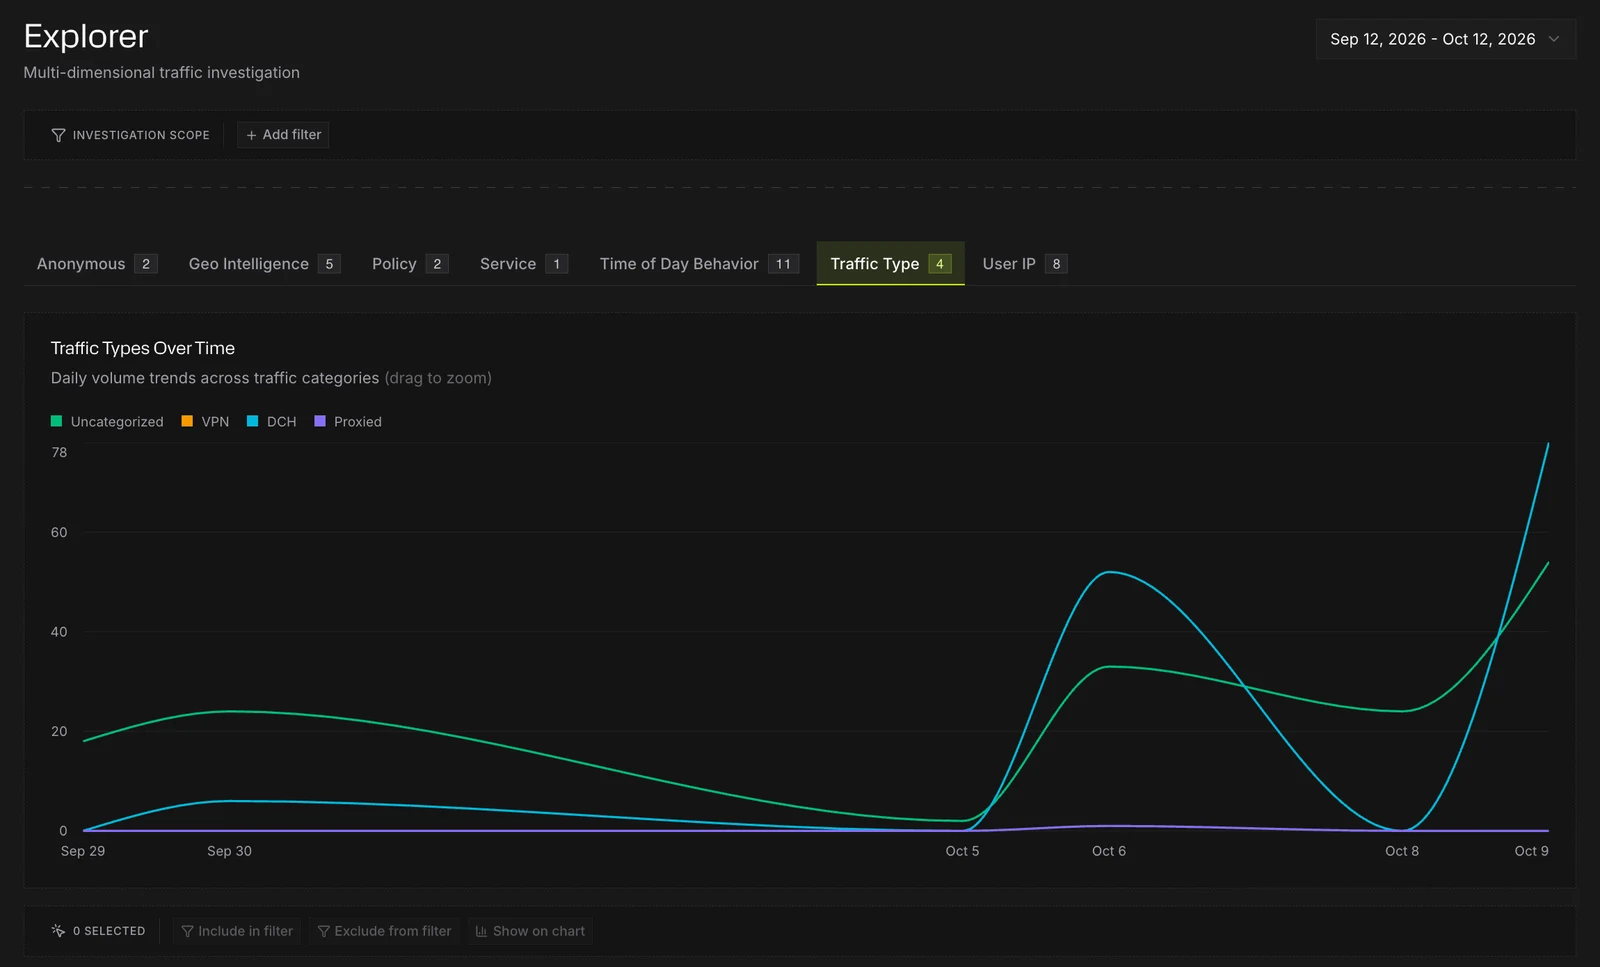
Explorer requires the Team plan or above. On other plans, it shows a preview with example data and an Upgrade plan button.
Choose a time range
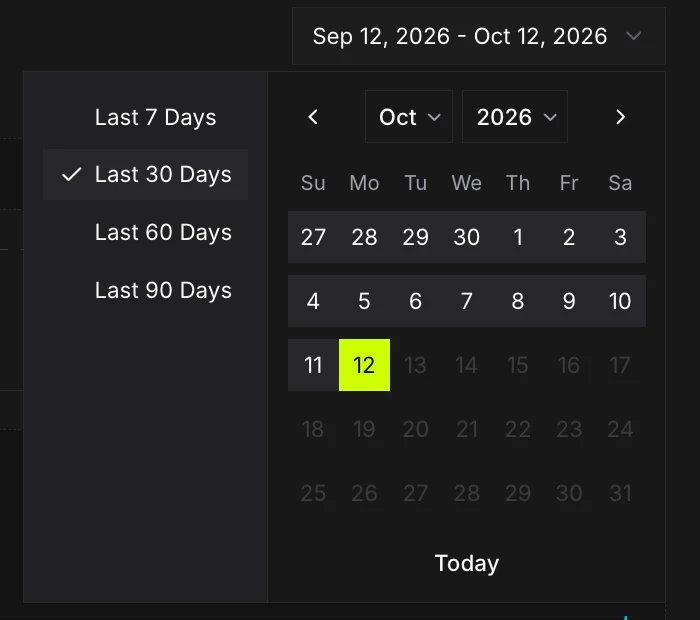
Pick a preset (Last 7 Days, Last 30 Days, Last 60 Days or Last 90 Days) or choose a custom range on the calendar. The calendar goes back 120 days, and a range can be up to 90 days long. If you pick a longer span, Explorer shows the last 30 days instead. Days run midnight to midnight UTC, and every tab, chart and table uses the range you choose.
Dimensions
Each tab breaks the same traffic down a different way. The number on a tab shows how many distinct values it has in the current range and scope.
| Tab | What it breaks traffic down by |
|---|---|
| Anonymous | Anonymous vs not anonymous sessions |
| Events | Traffic events Monocle detected, such as a spike from one service. Only shown on accounts with Events enabled. |
| Geo Intelligence | Visitor country |
| Policy | Policy decisions: allowed vs blocked |
| Service | The VPN, proxy or other service identified, such as GOOGLE_ONE_VPN |
| Time of Day Behavior | When traffic arrives, by hour of day (UTC) |
| Traffic Type | VPN, Proxied, RDP, DCH, AI Agentic, AI Crawling or Uncategorized |
| User IP | Individual visitor IP addresses |
Expand a row
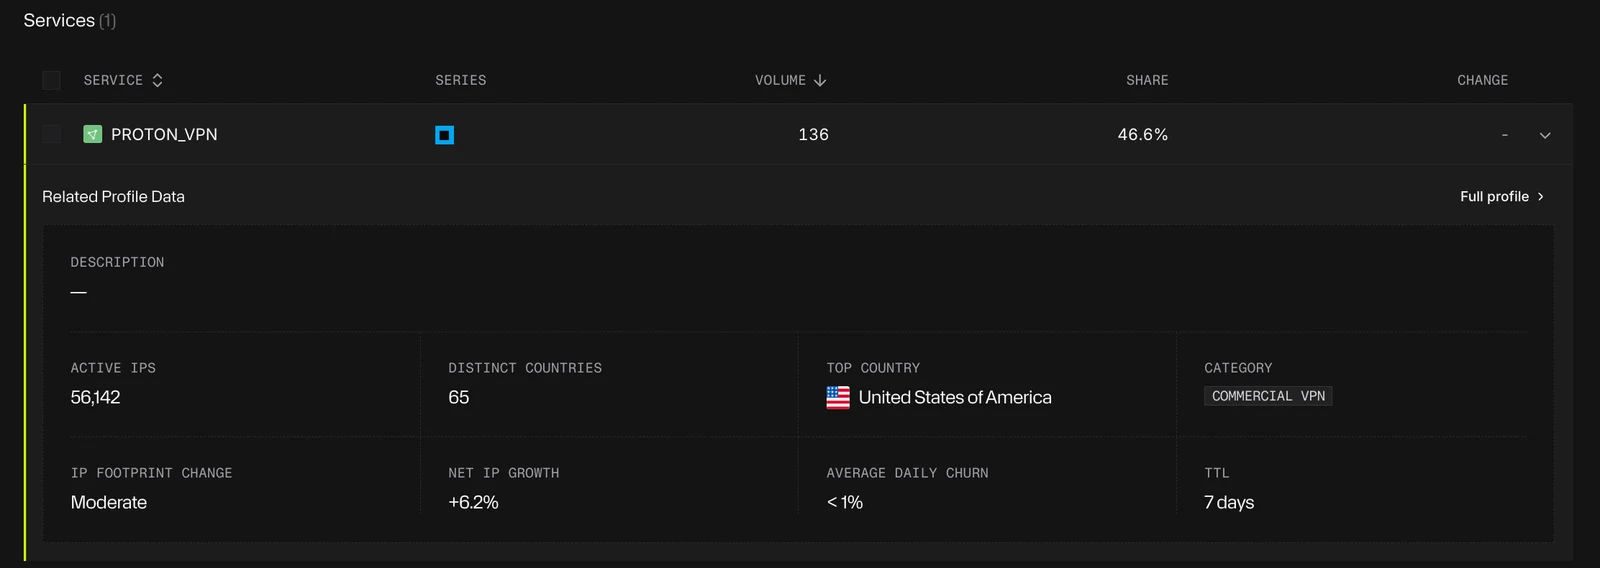
On the Events, Service and User IP tabs, expand a row for more detail:
- Events: the event's volume and duration, how much of it was anonymous or blocked, and its top traffic types, countries and IPs
- Service: active IPs, distinct countries, top country and category, plus how the service's IP footprint is changing (net IP growth, average daily churn and TTL)
- User IP: classification, service, infrastructure, service exit location and ASN, plus any risk indicators
On the Service and User IP tabs, select Full profile to open the service's or IP's full profile. See Expanding IP and Service Rows in the Explorer in the Knowledgebase.
Investigation Scope
Investigation Scope narrows everything on the page to the traffic you want to look at, including the Policy tab. Select Add filter, then choose a field, an operator and a value. Each filter shows as a chip you can change or remove, and Clear all removes them all. Filters on different fields must all match. On the same field, is values match any of them, and is not values exclude all of them. The count on each tab updates to match.
| Field | Operators | Example |
|---|---|---|
| AI operator | is, is not | AI operator is OPENAI |
| Country | is, is not, contains | Country is United States of America |
| Date | is | One day in the selected range |
| Service | is, is not, contains | Service is not ICLOUD_RELAY_PROXY |
| Source IP | is, is not, contains | Source IP contains 203.0.113. |
| Time | is, is not | Hour 14 and minute 30 (UTC), or either one alone |
| Traffic type | is, is not | Traffic type is not Anonymous |
Time is in UTC, and its hour and minute filter separately. Time is 14:30 keeps the single minute 14:30. Time is not 14:30 excludes the whole 14:00 hour and also minute 30 of every other hour. Explorer can't exclude a single minute of one hour.

Select, include and exclude
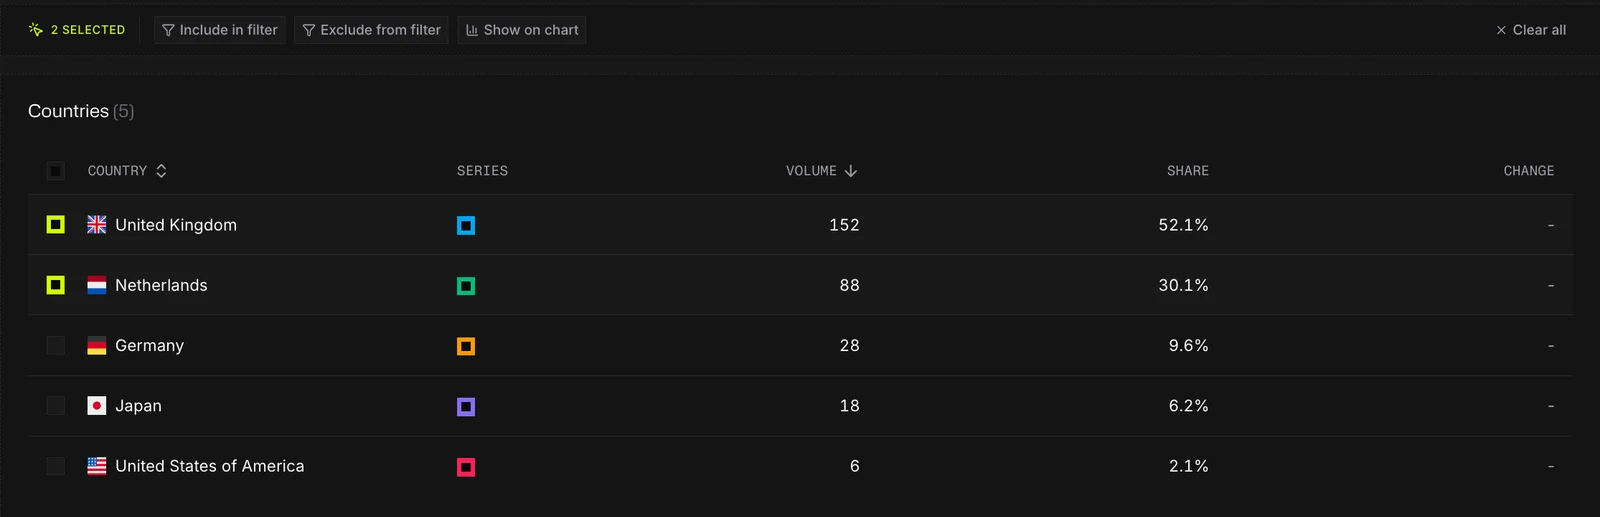
Select rows in a tab's table to act on them. The toolbar shows how many you've selected (2 selected, for example) and offers:
- Include in filter: add the selected values to Investigation Scope, so the page shows only that traffic
- Exclude from filter: add them as exclusions, so the page shows everything else
- Show on chart: plot up to five of the selected values on the chart, to compare them over time
Select Clear all to start over.
Investigating policy activity
The Policy tab shows how many sessions your policy allowed and blocked over time, for the range and scope you've chosen. Its rows can be shown on the chart, but not added to a filter.
Use it to compare traffic before and after a policy change. See Policies.